
This article was updated on September 30th, 2025.
Every business should have a website. And every business site should be doing serious work to support your goals! If you’ve got a new website but can’t tell if it’s doing its job, we’ve got your back. Let’s look at the essential KPIs to measure website performance.
Why Is It Important to Measure Your Website?
Just like regular checkups with the doctor, you should analyze your website’s health and performance to make sure it’s doing everything you had hoped and dreamed of. A website that’s launched and ignored can quickly become less of an asset, and more of a problem.
Think about the last time you visited a site that was totally unhelpful, or gave you such a poor impression that you exited without bothering to look at any content. Are you going to visit that site again? Heck no. Problems with SEO, user experience, and content quality can reflect badly on your brand. They can leak into reviews, cost you sales, and affect your word-of-mouth reputation.
That’s why I recommend setting up and regularly checking your own reports to measure website performance. You can use the default dashboard views in Google Analytics, or customize a visual tool like DashThis to pull data from multiple sources.
What Are Good Website Goals?
In order to measure how your website performs, you first have to define exactly what you want it to do. That way all of your data has a purpose. What are the profitable actions a visitor could take on your website? Those are likely your goals.
There are several general KPIs that are applicable to most websites. Everyone wants their site to deliver a smooth, fast user experience, right?
These are common website goals:
- Increase traffic (total, and per source)
- Increase dwell time (time on page)
- Fast page load times
- Attract new customers
- Earn links
- Rank well in the search results
The unique KPIs you use to measure website performance will depend on your business.
Technology companies often have a ‘book a demo’ or ‘free trial’ offering, so the goal would be to have potential customers complete that action. Email sign-ups and gated content downloads are great goals for businesses focused on lead generation. Clicking to get directions on your Contact page would be a solid goal for a brick-and-mortar business.
Now let’s talk about how to measure these and other performance goals!
12 Ways to Measure Website Performance
Before you get started, we recommend that you have at least two full months of data in Google Analytics or your other tracking tool of choice.
Tons of factors can cause spikes and drops in data, from campaigns and bot traffic to Google algorithm updates, holidays or seasonal browsing behaviour, and global issues. That’s why it’s ideal to compare year-over-year data: data from July of one year will compare better to July of the previous year than it would to June. But if your new site doesn’t yet have a year of data, month-over-month numbers are your next best bet to look for growth and declines.
You’ve got your goals, you’ve got your data – now let’s get started!
Measure Website Performance Using Google Analytics 4
These are the easiest, FREE ways to analyze your website using nothing more than the default Google Analytics 4 dashboards that open when you log in. They’re a great way to quickly check up on basic traffic and engagement metrics.
1. Total Website Traffic
More traffic is almost always a top goal. More website visitors means more opportunities for conversions! You can quickly look at your website’s total traffic in Google Analytics under Reports > Acquisition > Traffic Acquisition. Simply select a date range and comparison (previous period or previous year), and you can see whether there’s been growth or not.
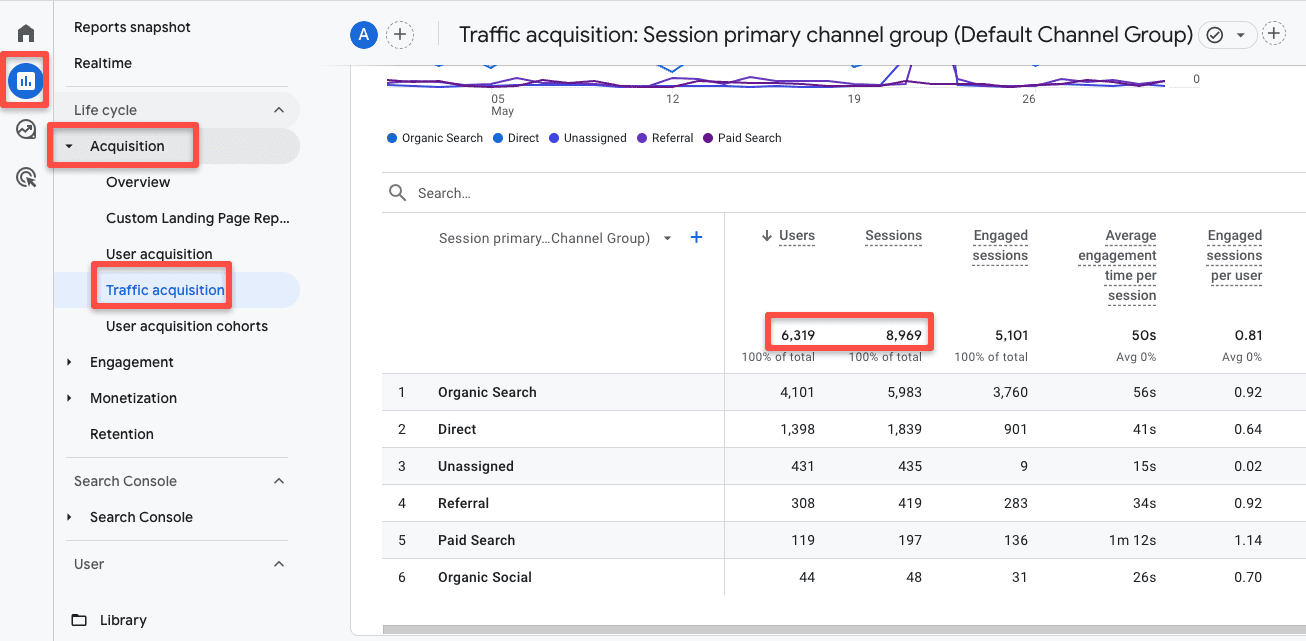
Sessions are the total number of times your site was visited. Users are your unique visitors – some people may have visited two or more times, so these two numbers are usually different.
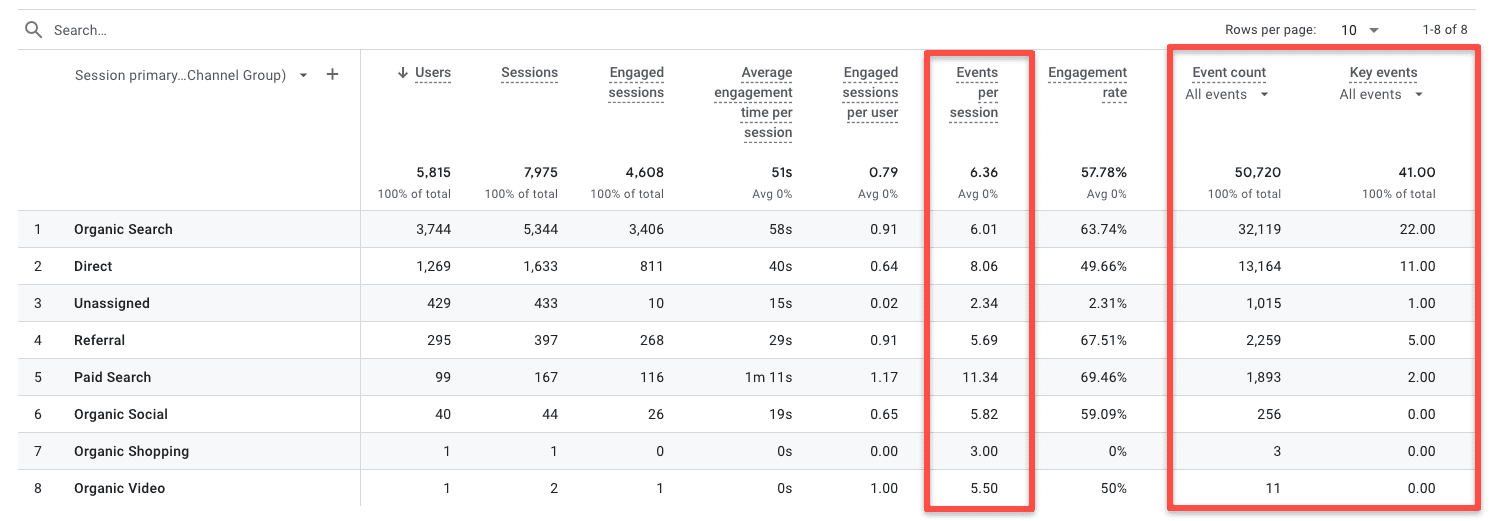
2. Visitor Engagement
Lots of visitors came to your website, but what did they actually do? For a high-level look at audience engagement, check right beneath the traffic stats found under Reports > Acquisition > Traffic Acquisition.
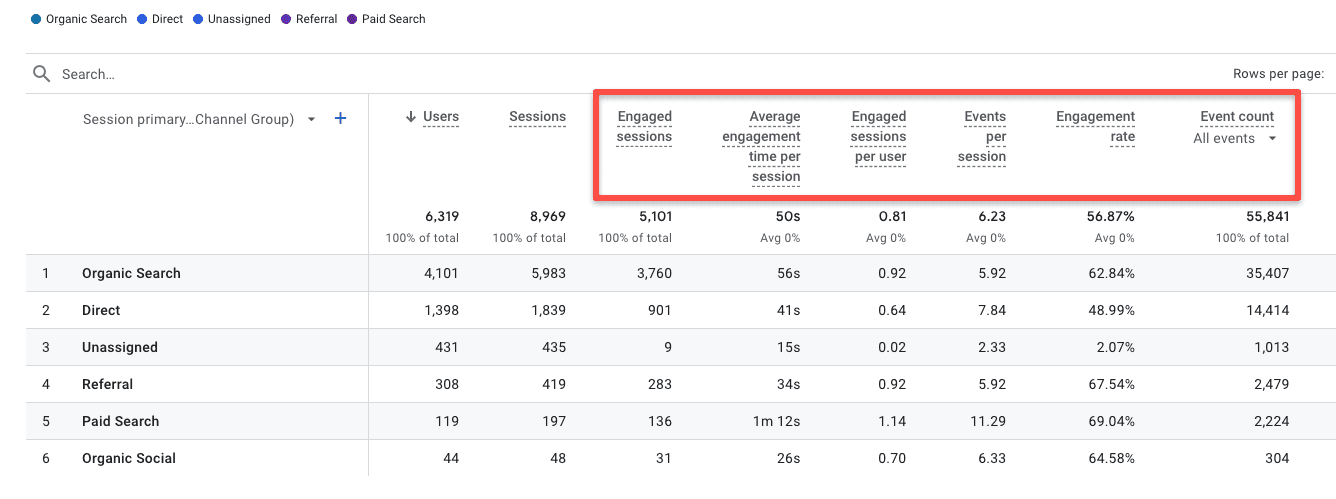
Engaged sessions are the total number of sessions that took at least one action, lasted longer than 10 seconds, or looked at 2+ pages
Engaged sessions per user measures the average session count per active user for the time period selected.
Events per sessions measures the average number of events (as you’ve configured them in GA4) that your users completed per sessions
Engagement rate is the inverse of the classic ‘bounce rate’, so it’s the total number of engaged sessions divided by the total number of sessions
3. Traffic By Source
Not all traffic is good traffic. For example, nobody wants more visits from spam and bots. And you may have experienced a total traffic increase that’s entirely due to an ad campaign while search traffic declined – which speaks to your SEO. That’s why it’s important to look at traffic by source, which you can find under Reports > Acquisition > Traffic Sources. The default view is by channel, but you can also toggle this column to view source/medium for a more granular look at your sources.
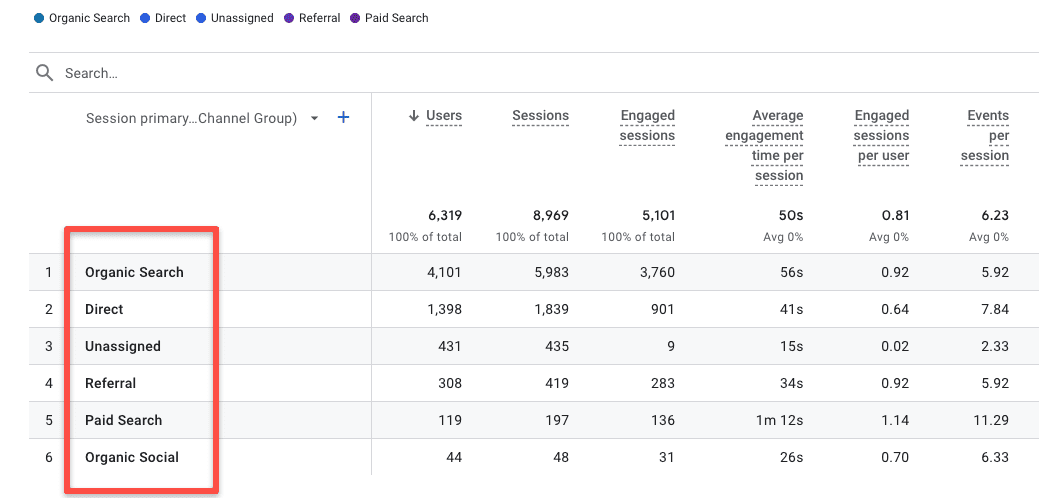
Here you’ll find traffic broken out by each search engine (Google’s not the only one!), social network, referral source, ad type, and more. You can view engagement data for each source. And if you have goals configured, you can see which sources are the highest and lowest converting.
4. New vs. Returning Visitors
If your business is still building its reputation, you’re likely focused on reach and awareness. Acquiring new website visitors would be a major goal. But if your site features lots of resources such as blog posts, white papers, and downloads, having a healthy ratio of repeat visitors would indicate success.
You can find this valuable data under Reports > Retention.
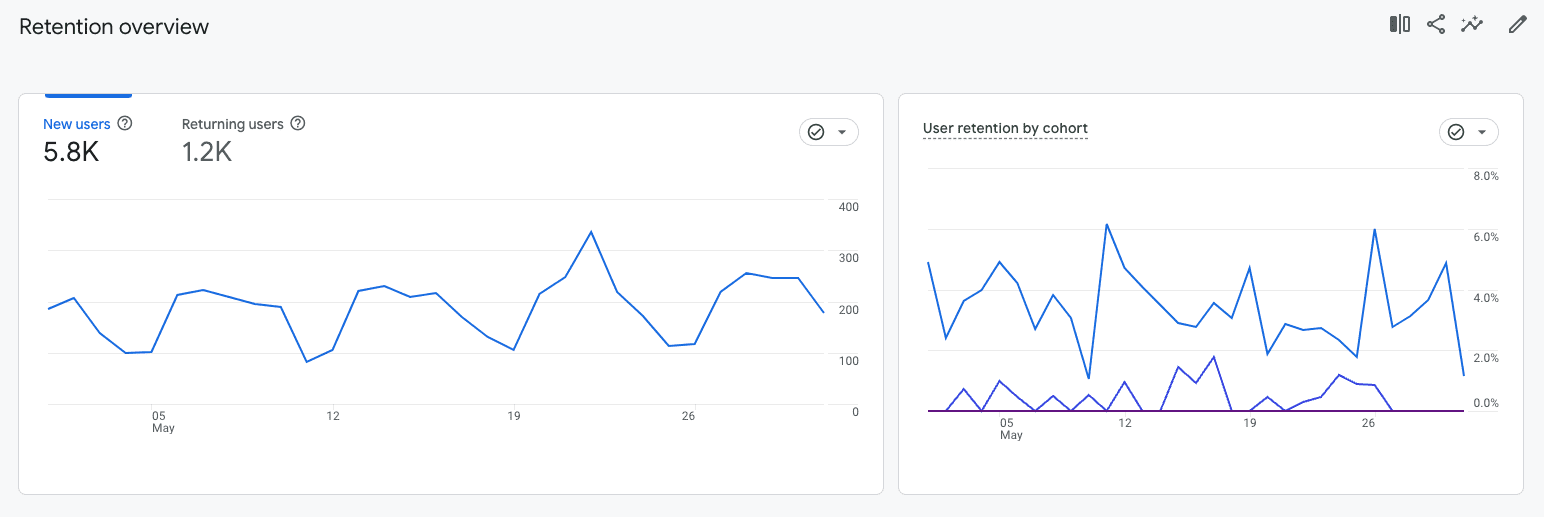
Repeat visitors are also a positive for B2B websites, because it typically takes more than one viewing of your services, case studies, and pricing to reach a B2B buying decision.
5. Time on Page
“Average time on page” was a feature of Universal Analytics that does not exist in GA4. Instead, we have average engagement time.
The average engagement time doesn’t include bounced sessions. So although 52% of your website traffic is still missing from this data (if your engagement rate was 48%), it’s significantly more valuable than the average session duration because all those zero-second sessions aren’t messing with your numbers.
You can find the average engagement time for each of your site’s pages under Behaviour > Site Content > All Pages.
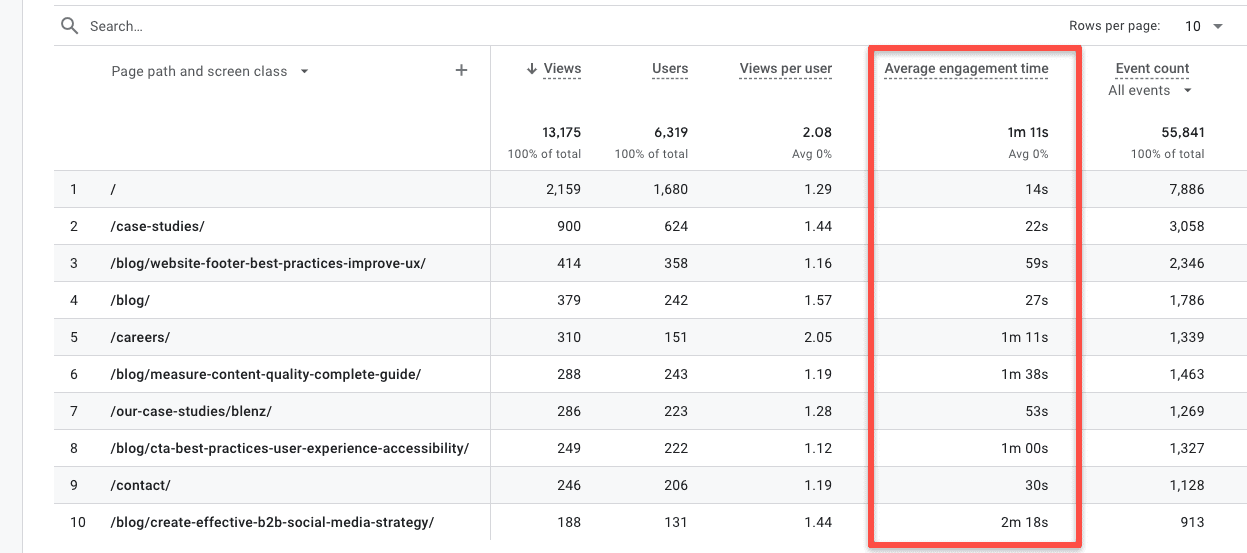
The ideal engagement time for a blog post or case study would be longer, depending on the length of the text. But for pages that need a speedy user experience, such as a checkout or contact page, you want to see short times.
6. Google Analytics Events
If you want to measure website performance like a boss, you need to track all the actions happening on your site that indicate engagement. GA4 comes with a bunch of super useful default events, and you can configure it to track more through Google Tag Manager.
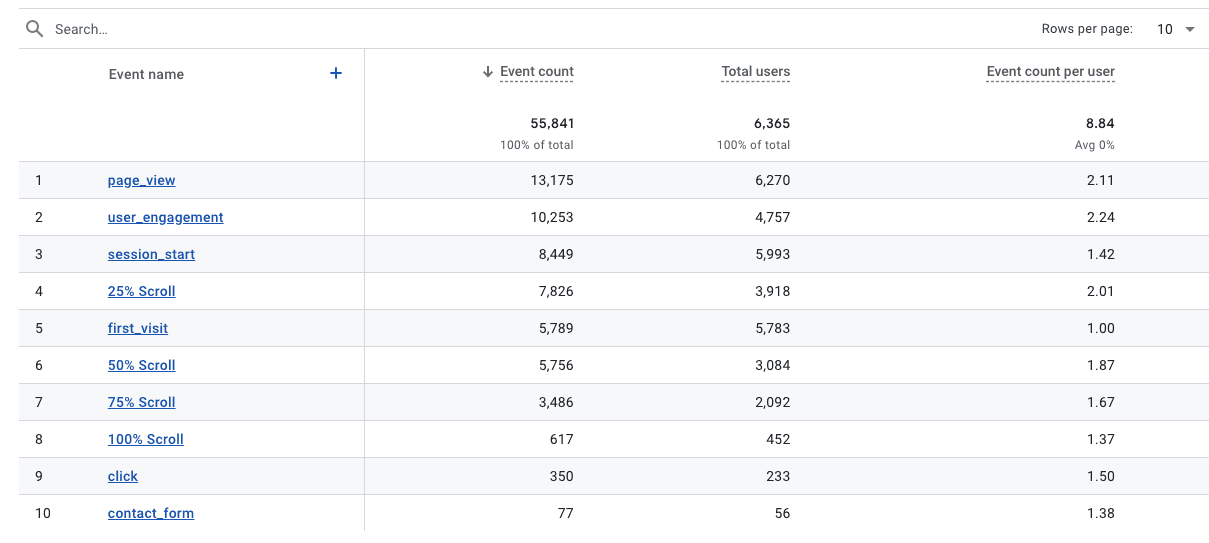
An event can be almost anything that indicates your target audience is interested in what you have to offer. Here’s a shortlist of popular events to track, with links to tutorials on how to configure them using Google Tag Manager:
- Video plays, pauses, and percentages
- Downloads
- Outbound link clicks
- Clicks on buttons, such as ‘where to buy’ or ‘buy now’
- Email newsletter opt-ins (track the ‘submit’ button click as above)
- Clicks to launch a phone call, email your company, or get directions
- Clicks to book a demo, free trial, or request a table (these are also click events, just unique to each button)
- Form submissions
- Clicks to visit your social profiles from the icons on your footer or contact page (hello, click events!)
Another popular event is ‘scroll depth’, which tracks how many people scroll down 25-100% of your pages. When paired with your average engagement time, this can really help you determine the effectiveness of your content!
Events are reasonably easy to configure once you’ve installed Tag Manager on your site. Don’t worry if at first it takes you several hours to configure one event, it will get easier!
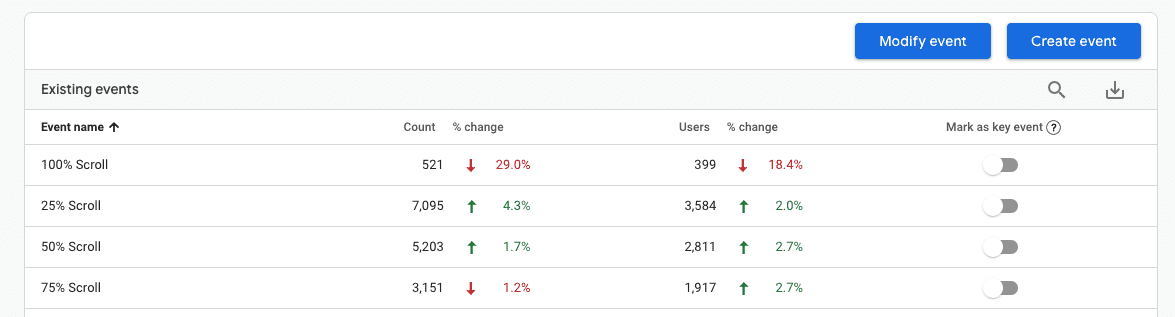
7. Google Analytics Conversions
GA4 has changed the labelling for conversions, but the purpose remains the same: they track how many people take a desirable and/or profitable action on your site. What that means to each company is different, but commons ones are a sign-up, a purchase, or a form submission.
Universal Analytics had events and goals, with goals being the conversions. GA4 started out with events and goals, but now (as of June 2024) it has events and key events. An event is set up for all conversions, big or small. But the ones you toggle to “key events” become conversions.
Typically conversions indicate that a sale was made or a lead was earned. Certain businesses or non-profits might find it just as useful to track micro-conversions that show intent to convert, that are an organizational goal (such as driving traffic to other sites through outbound links), or anything else that isn’t directly tied to leads and profit.
Conversions are a majorly important way to measure website performance, because they give weight to your other data, such as traffic sources or visitors from certain cities. You can see how well traffic from organic search is converting compared to email or social media, or how well BC traffic is converting compared to Ontario. This helps you adjust your SEO, advertising, and marketing strategies!
Events and Key Events are set up in the Admin panel, and can be viewed under Reports > Engagement > Events, or in the Events and Key Events columns of any dashboard.
8. Site Search
If someone takes the time to search for something specific on your website, they’re closer to conversion than those just casually viewing pages. If your site has a search functionality, you can enable site search tracking by turning on Enhanced Measurement in GA4 (in the Admin panel) and toggling on site search tracking.
Site search data helps you gauge both the usefulness of your UX design and the interests of your audience. If people frequently search terms that indicate they can’t find important content, you may need to move it someplace more obvious. And a high search volumes of searches for certain content indicates a strong interest in that area (and an expectation to find it). If you don’t have much or anything on the topic, this is a great place to focus content efforts.
Off-Site Ways to Assess Website Performance
Although I could gaze into Google Analytics for days (and I often do), there are lots of other KPIs to measure website performance. Let’s look at the other tools and methods you can use to assess crucial performance components like speed, links, ranking, and value to your audience.
9. Keyword Rankings
Your position in the search results reflects the strengths and weaknesses of your website’s SEO. So it makes sense that you should regularly check to see which queries your site ranks for, and how you’re doing.
There are several powerful SEO tools that you can use to see your keyword rankings, and most will let you see at least some limited results with a free account. We use SEMRush to quickly gather keyword data for our site and our clients’ sites.
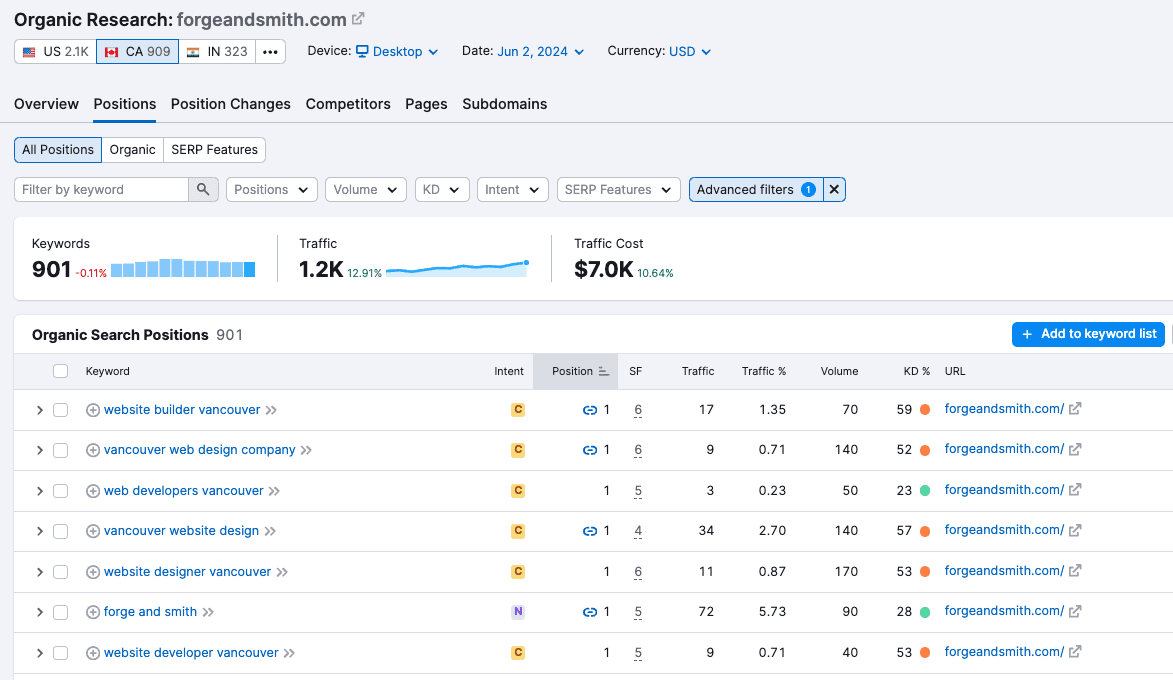
You can see the terms for which your pages are already ranking and your position, as well as useful information like how hard it is to rank organically for that keyword. Then you can plan website improvements and new content geared toward increasing your position, or ranking for terms not on your list.
10. Site Speed
Page load times impact your user experience, and weigh heavily among Google’s ranking factors. A slow-loading page often results in the visitor exiting without even reaching your site, which is bad for business. That’s why you should always look into site speed when you measure your website performance.
We recommend using a free, handy online tool like Google’s PageSpeed Insights or GTMetrix. These tools don’t just tell you how URLs are performing – they also offer tips to make them faster!
11. Earned Links
We’ve already talked about several ways to measure your content’s quality: dwell time, scroll depth, page ranking for keywords, and engagement within the page (outbound or internal link clicks, video plays). Link building is also a big part of helping your site and its content rank, so links are a great unit of measurement.
Links from other websites share their SEO ‘juice’; Google bots crawl the other site’s links and follow them to your site. The linked text helps Google understand how and why you’re related to the topic discussed on their page, and the link itself helps you build authority. The best links come from super-trustworthy sites like those ending with .edu and .gov, because if they trust you then you’re obviously the real deal.
You can see your links as referral traffic in Google Analytics, under Reports > Acquisition > Traffic Acquisition.
You can also use an SEO tool like SEMRush to analyze your link profile, remove potentially toxic links from low quality sites, and get ideas for link building campaigns.
12. Social Media and Email Data
Just like checking up on your keyword rankings, you can learn a lot about your content’s quality through social media and email platform data. Although comments and shares can be useful, we’re specifically talking about clicks.
Clicks from shared content through to your website help you measure the relevance and usefulness of the content you’re publishing on your website. You can test custom titles and meta descriptions (social) or headlines and teaser copy (email) to see what earns the most clicks.
Pair that post click or CTR data with Google Analytics data on dwell times and scroll depth, breaking it out by social channel or email campaign and per landing page. Ta-da! You get a clear idea of what your most connected audience cares about.
We hope this list has helped you start analyzing your website! How you measure its performance will of course depend on your business, and the unique needs of your audience. The most important KPIs will be the ones that reflect your business goals.
Share post:
About the Author
More by This Author