Hi there! This article on how to learn Google Analytics was updated on October 8th, 2019.
Google Analytics looks intimidating. For a first-time user, all those charts and terms can seem like an impossible amount of information. Where to even begin? How long will it take to understand what the heck is going on with your numbers? Is it even worth trying to learn Google Analytics?
I’m here to tell you that you can — and should — get comfortable with how to read basic Google Analytics data. It’s the key that unlocks the secrets of your website and your customers, from how people engage with your content to whether your SEO strategy is working. This data can help you increase conversions, drive sales, and make your users genuinely happy.
Happy users spend money, and come back to do it again.
Actionable tips are waiting for you, right there in the standard Google Analytics dashboard. Let’s get started.
Post Contents
How Does Google Analytics Work?
Google Analytics harvests data via a snippet of JavaScript code, embedded in your website. It’s like a private investigator, detecting highly useful information to deliver to your marketing and sales teams.
This code tracks user details and behaviour, including:
- Where the user is from, right down to the city
- What device they’re using, including operating system/browser
- Demographics such as age and gender
- User interests/affinity categories
- How the user landed on your site (search, social media, etc.)
- Which page(s) the user engaged with
- How long their session lasted
Other exciting data that you can track through Google Analytics with additional configuration includes user behaviour related to ad campaigns, contact forms/goals, e-commerce including complete path-to-purchase funnels, clicks/plays on specific content, and more.
While some data is protected through privacy settings in user sessions, or is untrackable, plenty of data is available through the different options within the default dashboard.
How do I set up or reconfigure Google Analytics tracking?
If you’re keen to learn Google Analytics, obviously you first need to have it set up on your website. To set up Google Analytics for the first time, visit analytics.google.com and go through the steps to configure a new account.
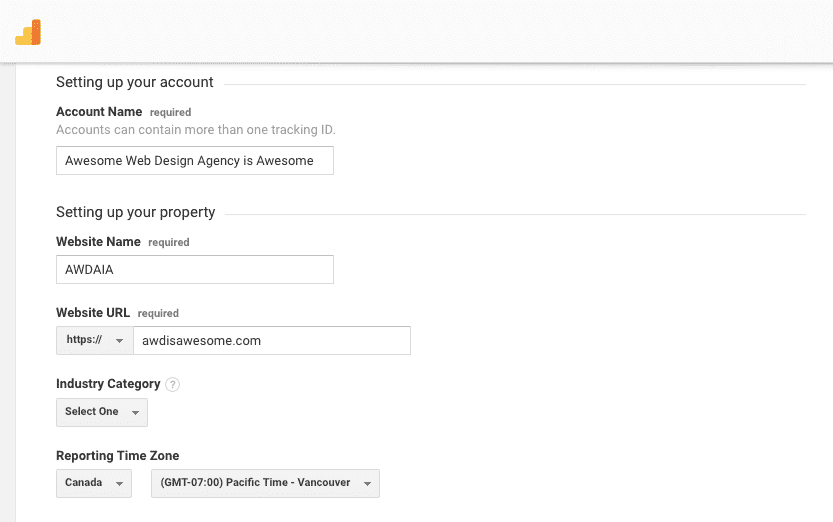
- Name your account (keep it simple: your business name is sufficient)
- Name the property (you might acquire access to more websites later, so this title identifies this particular website)
- Enter your website URL (be sure to accurately set it to HTTP or HTTPS)
- Select your industry category and time zone
- Configure the data sharing settings (leaving them checked is fine, Google has extremely tight security — or uncheck sharing as needed)
- Click ‘get tracking ID’
There are multiple ways you can add your first Google Analytics tracking ID to your website, whether you do it yourself or have a web developer assist. Google provides instructions for how to set up Google Analytics tracking, including how to verify that it’s working.
If you’re accessing an existing Google Analytics account and suspect the tracking code is no longer working properly, follow these steps:
- Visit analytics.google.com while logged into Google as the admin account
- Access the tracking ID through the admin panel (the gear icon in the bottom left corner)
- Send test traffic — you’ll see right there under ‘status’ if there are active users being tracked on the website
- If the status shows at least one active user after sending traffic, you’re all set!
- If there are no users while sending test traffic, the code needs to be re-added to the site
Word to the wise: You should always set up Google Analytics using a company email, either a generic account or one owned by someone not likely to leave the business. The Forge and Smith team often works with small businesses that had a marketing agency or web developer configure their Google Analytics using a third-party email. If you lose touch with this administrator, or if the relationship goes sour, you’ve lost years of precious data!
While Google Analytics does provide recovery steps, it’s a lengthy, complicated process — and easily avoidable. If you’re not comfortable setting it up yourself, or if you don’t have time, provide an agency or developer with your company login so that you retain full ownership of your account.
How do I read Google Analytics data?
The next step to learn Google Analytics is to dive right in to the main dashboards! We’ll start with how things are presented.
Your data is sorted and viewed through dimensions and metrics.
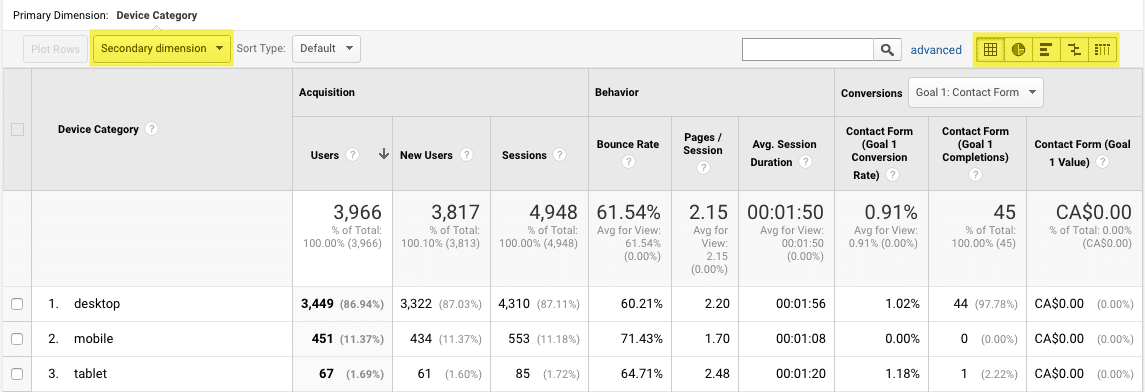
A dimension is the qualitative bucket for your data, such as the user’s city, device, page, or channel. Many views within the Google Analytics dashboard allow you to add a secondary dimension, so you can dig even deeper and see things like your organic search traffic sorted by its countries, regions, or cities of origin.
Metrics are the quantitative units you can use to view your traffic. For example, you might want to look at your case studies’ visits by total sessions, or by bounce rate, or by the average time users spend on-site after landing on a case study.
Data also has multiple views, which you can choose depending on your preference. Switch between numeric lists, pie charts, bar graphs, comparison charts, and pivot tables. These come in especially handy when creating custom dashboards, and exporting your data for others to view.
Which Google Analytics data should I be looking at?
The data that matters most to you will depend on your reason for checking Google Analytics that day.
It might be your first time looking at your website’s data, and you want a general sense of how it’s performing. You could be checking on the performance of changes to your organic social media strategy, or your company might be considering a website redesign and seeking data to support critical areas of improvement.
Here’s our list of general areas on the default dashboard to help new Google Analytics users get a straightforward idea of how your website and digital strategy are performing — and how to make them stronger.
Audience Overview
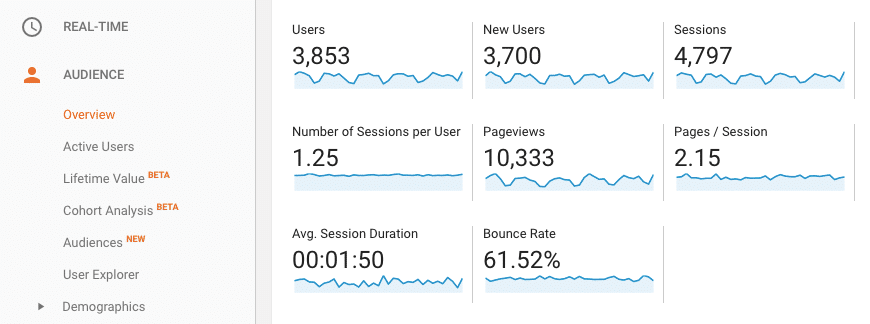
The quickest, high-level look at your site performance is all in one handy place: the Google Analytics Audience Overview.
The number of users indicates how many unique users visited your website during the set period.
Sessions are the total number of visits to your site, which is how new and returning visitors are identified — each visitor has a unique ID tracked through a cookie. On their first visit (or after clearing their browser cookies), their data is categorized as a new user session. On repeat visits with the cookie intact, they would be identified as a returning visitor.
This is why the number of users is typically different than the number of sessions.
Bounce rate
A bounce is tracked when a visitor lands on a page and exits without taking any other action. Bounces are undesirable in most cases — you want potential clients and customers to be looking at other content on your website, right? That’s how they move through the buyer’s journey toward a contact or purchase.
Unfortunately, scrolling is not an action. This means that even if the user spends five minutes reading an insightful article before exiting, a bounce is still tracked.
The weight of bounces is debatable – in fact, we wrote a complete guide to your bounce rate (and how to fix it). You can assess the quality of your pages and posts by looking at their other metrics, like pageviews and average time on page (in the Behaviour > Site Content > All Pages report), to figure out how that content is performing.
However, Google’s current algorithm uses visitor engagement behaviour among its ranking factors, which means that spending more time on your site and engaging with multiple pages indicates quality and relevance, while bouncing can indicate that the user didn’t find what they needed.
If your bounce rate is high (expert opinions vary, but anywhere from 60-70% is generally the starting point for a high bounce rate), here’s what you can do:
- Dig deeper: look into your traffic channels, user locations, devices, and individual page performance to see where those high bounce rates are coming from, and address them. Ex. if you have a healthy bounce rate for desktop sessions but a high bounce rate for mobile, look at mobile user experience improvements. If popular pages have a high bounce rate, check to see if they have a slow load time, or outdated/unappealing content.
- Focus on lowering your bounce rate where it counts: Obviously someone landing on your contact page is likely to bounce, but you can apply a stronger user experience to other pages and posts by encouraging more actions. Feature related content, and use strong copy to facilitate the journey.
- Avoid misleading teasers, keywords, and image tags: Create social media post copy and meta descriptions that tell a visitor exactly what to expect when they reach your site. Make sure you aren’t repeatedly using keywords that don’t align with your content — this might seem obvious, but it’s actually common for websites to come up in search results for totally non-related keywords. Use the free version of an SEO tool like SEMRush to run a report on your site’s current keywords and rankings.
- Set external links to open in new tabs: If you’re linking to an article with supporting data, don’t risk losing that visitor on the chance that they’ll click ‘back’ to your content. Remove the possibility, and make sure your content stays open in their browser.
Time on site
Your average session duration is quite literally what it suggests: a measurement of how long the average user spends on your website.
As mentioned under Bounce Rate, longer session durations are desirable because they tell search engines — and you — that your content is high quality, relevant, and useful. To increase user session times, you can try a few things:
- Create rich content that encourages longer reads, like blog posts, case studies, and white papers
- Use strong inter-site navigation opportunities like related or featured content to facilitate reading other content during a session
- Don’t just promote single posts! You can share case study and blog landing pages via email and social media, encouraging a niche audience to browse them as a resource
An important note about the “average session duration” seen on most default dashboards: Google Analytics calculates all bounced sessions as 0 seconds. This heavily impacts the average session duration for your whole site, and for any view that includes that data. Instead, focus on the dwell times (average time on page) for each piece of content or page; this is found under Behaviour > Site Content > All Pages.
Pages per session and pageviews
The average number of pages a visitor views is also linked to bounce rate and dwell time in being a quality ranking signal.
If a visitor reads a piece of content and is motivated to explore the site further, it indicates that they found the content interesting and helpful, and want to see what else your site offers.
The same methods for improving bounce rate and dwell time apply to increasing your pages per session — deliver more high quality content, amplify it on social media and by email, and give visitors more encouragement to browse.
Pageviews are recorded each time any user visits a page, including hitting refresh or back during the same session. The total number of pageviews divided by the total number of sessions produces the average pages per session.
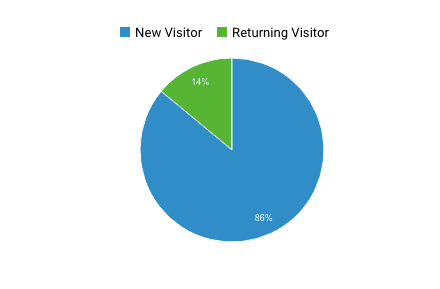
New vs returning visitors
How many people are visiting your site for the first time, and how many are on a second or third visit? This data can be extremely useful in determining if your SEO is working to drive new customers, if your site succeeding as a resource, or if it’s being used to research your company as a potential business partner.
There are lots of ways to increase the number of new visitors to your site:
- New or improved on-site SEO strategy to drive organic search traffic
- Adding a social media platform that suits your target audience
- AdWords or display advertising
- Influencer marketing on social media
- Seeking backlink opportunities on relevant, quality websites
To increase your ratio of returning visitors, consider these methods:
- Increased production of useful, relevant content (quality, not quantity!)
- Improving your website’s user experience
- Incentivizing social media visits through increased sharing of new and existing site content
- Adding or improving email distribution that shares site content
Location
You can learn a lot about your website from your basic Google Analytics dashboard view of location traffic. Found under Audience > Geo > Location, this illustrates exactly where your visitors are coming from.
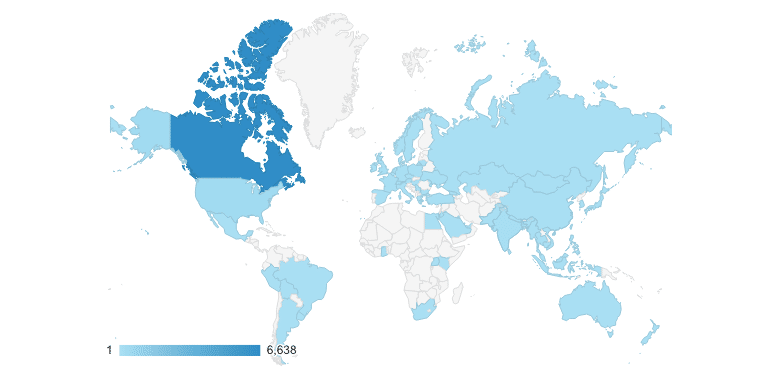
If you’re a brick-and-mortar local business, but getting quite a bit of traffic from other cities or even countries well outside your service area, you likely need to revisit your local SEO and should consider adding voice search SEO.
If your business is online or international, and certain countries have poor user engagement numbers, assess how to improve the user experience in those countries. Is it a device or browser issue? Does your content appear only relevant or available to one country? Could you add geo-location filtering to deliver a more customized experience?
Location-specific issues can be explored by narrowing the view to cities, or by adding secondary dimensions to the location traffic: device, traffic channel, or other user and acquisition dimensions.
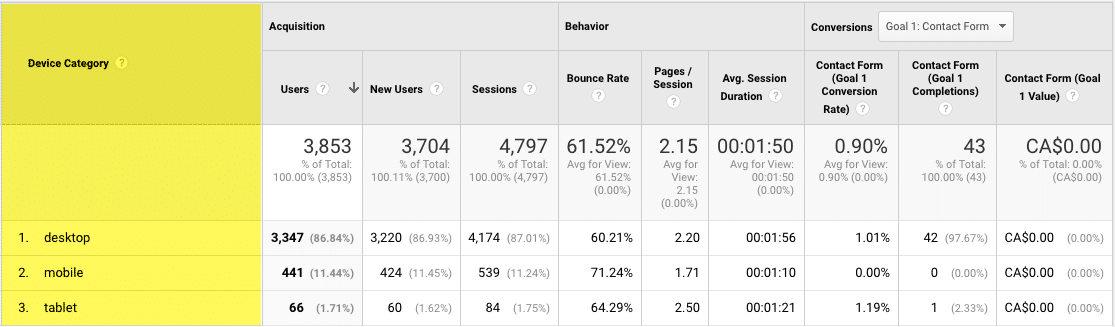
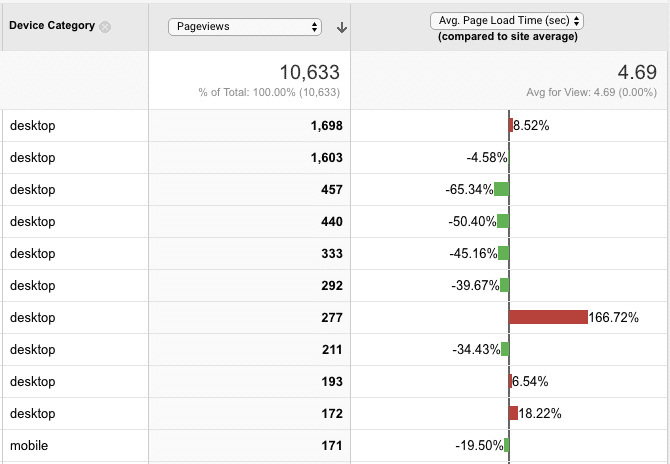
Devices
Google’s mobile-first prioritization makes having a quality mobile user experience important. But what does that mean?
Mobile versions of websites will be indexed and used over desktop versions, in reaction to the rise of mobile searches. Mobile-friendly websites have already been favoured in search results over ones with a poor mobile experience, but now it’s increasingly important to deliver a quality mobile experience.
That said, B2B industries often see significantly more desktop traffic. While Google will first index the mobile versions of websites, it will still index desktop versions. Think audience-first when assessing your device traffic, and make sure the engagement behaviour is on-point for your ideal customer’s reading environment.
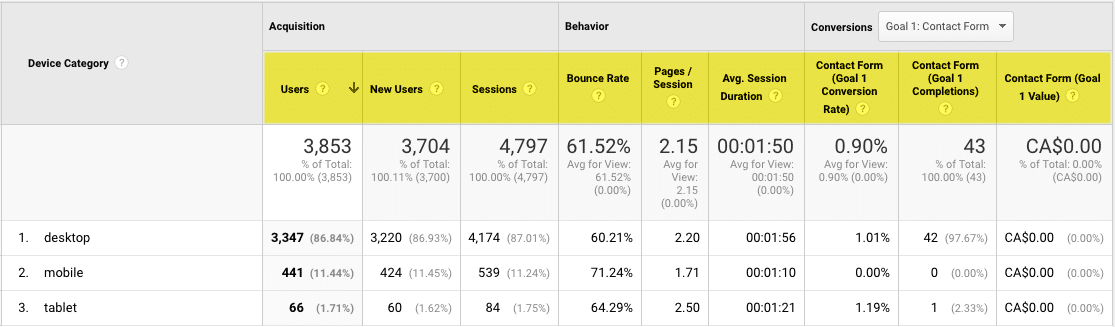
- Add secondary dimensions like country or channel to dig further into your device data
- Social media traffic tends to have a high bounce rate and lower time on site/pages per session, so if your site gets a lot of social traffic compared to other channels, it might not be cause for alarm
- Look at your landing pages report and add devices as a secondary dimension to see if certain popular pages have issues
If any of your devices are showing poor user engagement, take time to test your website on those devices. It might be a simple fix, like compressing images to improve load times.
Channels
One of the best — and easiest — ways to assess your digital strategy efforts is by looking at your traffic channels report. Found under Acquisition > All Traffic > Channels, this report gives you an overview of how your visitors are finding your website online.
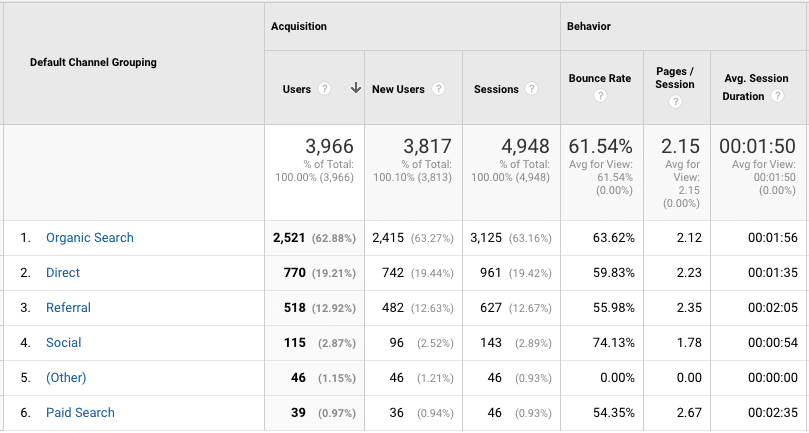
Organic search traffic is visitors coming to your site after typing a query into a search engine and clicking to your site from the results. You can increase organic traffic through improved on-site SEO, and by creating new quality, optimized content every month.
Want the full scoop on organic traffic? Check out 5 Reasons Why Organic Traffic Matters (and How to Get It)!
Direct traffic is a tricky ‘grey area’, in that there are multiple factors that can result in traffic being categorized as direct. Here are the most common:
- Someone typing your site’s URL directly into the address bar
- Access via a bookmark
- Dark social shares that can’t be tracked (ex. links passed through Facebook Messenger, Skype, WhatsApp)
- Access via a link in a Word document, slide, PowerPoint, or other non-web material
- Visits to an HTTP (non-secure) site from an HTTPS site — this is just one of many reasons why it’s important to have your website securely hosted
Direct traffic is also the holding place for traffic Google is unable to categorize. Direct traffic can often be returning visitors.
Referral traffic comes from links on other websites. For inbound links (also known as backlinks), this is where to view that traffic in Google Analytics. Backlinks from trustworthy sites can improve your ranking and authority. Unfortunately, links from low quality websites can drag yours down, so it’s a good idea to monitor your site’s backlinks.
Social traffic comes from social media. You can dig deeper into social media traffic to see how content you shared is performing, and to see which platforms are sending the most — and best — visitors.
Other types of traffic you might see include paid search, display advertising, and email.
We like to visit Acquisition > All Channels > Source/Medium to see exactly how our search engine and social media visits are broken down (and this is especially good for businesses with lots of campaigns):
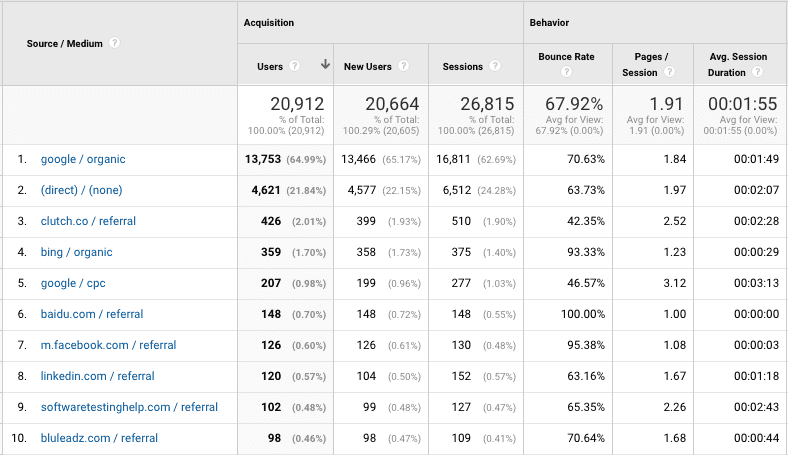
Landing pages, page performance, and exit pages
Which pages are the first ones your audience hits when checking out your business? These are your landing pages. Found under Behaviour > Site Content > Landing Pages, this report shows you the entry points for your website, and how they’re performing.
It’s common for your homepage to be the most-visited page on your site. After all, it’s usually linked everywhere your site is listed online, as well as in company email signatures, social media profiles, and print materials. It’s a likely candidate for someone starting to explore what your business is about before engaging.
If it’s important to your business that certain pages attract the most initial sessions, here are some suggestions:
- Share these pages on social media and by email
- Ensure the metadata descriptions (which are shown in search results) have appealing copy
- Stay on top of optimization, and keep these pages up-to-date with current keywords and fresh copy as needed
To see how all of your pages are performing, you can navigate to the All Pages report as mentioned previously: Behaviour > Site Content > All Pages. This is where you can see how many pageviews each page and post on your site is getting, and how users are engaging with them as far as dwell times and exit rates.
Exit pages are the last page a visitor views before ending their session and leaving your site. You can use this data to assess if certain pages are sending customers packing when they shouldn’t be.
Look for ways to improve frequent exit pages through better quality content, improved user experience, and other methods discussed in this article. Don’t forget that social media visitors are more likely to bounce, so don’t sweat too much over exits from blogs!
Page timings
We live in an impatient world. We want everything now — or better yet, five minutes ago. A slow website in this day and age will definitely lead to bounces. Check up on your site with a free speed checking tool (Google even has its own), and look at your Site Speed report in Google Analytics.
Found under Behaviour > Site Speed > Page Timings, this can help you weed out pages that might be contributing to a higher bounce rate, which of course means missed opportunities to capture and retain those potential customer sessions.
These are our tips to learn Google Analytics and assess your business website and digital strategy. Once you get comfortable with basic Google Analytics, you might switch to Google Tag Manager or another tracking system, start tracking goals, and use even more of the exciting data analysis options. Good luck!
Pam Berg
Pam has backgrounds in journalism, computer forensics, and public libraries, which add up to the perfect mindset for digital strategy. She's been a professional content writer for over 20 years, and working with clients in SEO and analytics for 8 years. Her Instagram feed is equal parts horses, waffles, and drag performers.
More By This Author